 Ask The News lets news organizations deploy AI-powered search tools using their own journalism, while giving them new audience insights
The post The Washington Post’s Arc XP launches AI answer tool to help keep readers in their ecosystems appeared first on The Media Copilot.
]]>By
The growing popularity of AI chatbots is reshaping how audiences discover news, with one in 10 people worldwide now using tools such as ChatGPT, Perplexity and Google’s AI Overviews for news at least weekly, according to the Reuters Institute for the Study of Journalism’s Digital News Report 2026.
On July 13, Arc XP, a media operating system developed by the Washington Post, launched Ask The News, an AI-powered conversational search tool that publishers can embed on their own sites. Users can ask questions of Ask The News, which answers using the publisher’s reporting with attribution and editorial safeguards. The tool will decline to answer questions when it does not have enough source reporting to generate a confident response, Arc XP says, rather than hallucinate an answer.
Arc XP’s Subscription Gateway, a capability embedded into Ask The News, changes the traditional paywall model by limiting AI-generated answers rather than articles, prompting readers to subscribe after they have received value from the tool.
For newsrooms, the tool could offer a new way to understand audience demand. Instead of relying on clicks and page views, Ask The News allows publishers to see what questions readers have and subsequently use those insights to guide coverage decisions.
“Search shows links. Generic AI gives answers from the open web,” said Joey Marburger, Vice President of Content Intelligence, Arc XP. “Ask The News answers with a publisher’s journalism, rules, and business model. This is about building a durable reader habit: when you have a question, you go to your trusted news organization first.”
As AI-generated answers become an increasingly common way for people to access information, publishers may be forced to rethink how their reporting reaches audiences through emerging AI experiences in addition to through traditional means.
Ask The News is now available to Arc XP publisher partners with a JavaScript embed option for non-Arc XP publishers. Arc XP plans to expand the tool with features including personalized briefings, saved conversations, topic tracking and editorial intelligence dashboards.
The post The Washington Post’s Arc XP launches AI answer tool to help keep readers in their ecosystems appeared first on The Media Copilot.
]]> One platform watches your audience in real time; the other reveals what your audience has been telling you for months.
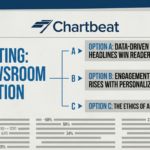
The post Chartbeat vs. Parse.ly: Two approaches to the same newsroom problem appeared first on The Media Copilot.
]]>Content analytics platforms have become essential infrastructure for newsrooms trying to understand what resonates with their audiences. The days of publishing stories and hoping for the best are over — or should be. But choosing between platforms means understanding not just what each tool does, but how its approach fits your newsroom’s size, publishing rhythm and strategic priorities.
Key Takeaways
- Chartbeat focuses on real-time activity; Parse.ly emphasizes historical data.
- The two platforms answer different questions: now vs. months of patterns.
- Choice depends on size, publishing rhythm, and which lever matters most.
Parse.ly positions itself as “content analytics for everyone,” emphasizing ease of use and historical data analysis. The platform, owned by WordPress parent company Automattic, aims to democratize access to the metrics publishers need without requiring coding skills or dedicated data analysts. Its sweet spot is helping smaller editorial teams track meaningful trends over days, weeks and months rather than minute-by-minute fluctuations.
Chartbeat takes a different approach, building its product around real-time dashboards that show editors exactly what’s happening on their sites right now. The platform’s three-panel dashboard — organized around who is on the site, what they’re reading and where they came from — gives newsrooms the ability to make immediate editorial adjustments. Its headline A/B testing feature, which mid-sized newsrooms have called its standout capability, lets editors optimize story presentation without touching their CMS.
Both platforms track engagement metrics beyond simple page views, and both aim to help newsrooms make smarter editorial calls. But they differ meaningfully in their emphasis on real-time versus historical data, their feature sets, their pricing and the types of newsrooms they serve best.
Where Parse.ly stands out
Parse.ly’s strongest advantage is its handling of historical data. For newsrooms that publish a handful of stories per day rather than dozens, real-time traffic numbers are less actionable than weekly or monthly trends. Mike Janssen, digital editor at Current, a public broadcasting trade publication, found that Parse.ly’s historical views revealed patterns invisible in real-time dashboards — for instance, that layoff stories consistently performed well. “Month to month, if you look at our top 10 stories in terms of page views or any metric, it’s largely layoffs,” he says.
WordPress integration is notably frictionless. Because WordPress owns Parse.ly, setup amounts to installing a plugin and entering some configuration details. For the significant number of newsrooms running WordPress, this eliminates a technical barrier that can slow adoption. Janssen describes the process simply: “If you can install a plugin and insert some information into boxes in your CMS, you’ll be fine.”
Parse.ly also tracks what content drives specific audience behaviors — such as when readers become subscribers — and lets individual users customize their views to focus on specific sections, beats or content categories without building complex queries. For a reporter covering city hall, that means comparing story performance against other local government coverage rather than against sports, which typically draws more raw clicks. The platform’s approach to data collection and privacy is straightforward, with de-identified tracking and GDPR/CCPA compliance baked in.
Where Chartbeat stands out
Chartbeat’s real-time dashboard is the core of its offering. Brad Streicher, a Chartbeat customer success manager, describes the three-section layout: “‘Who’ on the left, ‘what’ in the middle and ‘where’ on the right-hand side.” The platform shows concurrent users, engagement time, recirculation rates, traffic sources and top-performing stories — all updating continuously. When a story experiences a sudden traffic surge, Chartbeat sends spike alerts so editors can capitalize on the momentum by adding related links, multimedia elements or social promotion.
The platform’s heads-up display for homepages lets editors see which stories are over- or underperforming compared to historical averages for that position, enabling quick swaps to maximize readership. But according to Ian Swenson, director of news and audience analytics at The Salt Lake Tribune, Chartbeat’s “killer feature” is headline testing. “None of the competitors do that nearly as well,” he says. The platform tests multiple headline options — including AI-generated alternatives — and automatically selects the winner without requiring any changes in the CMS.
Chartbeat’s approach to engagement metrics also emphasizes sustainability over raw traffic. The platform encourages newsrooms to focus on time spent on page and recirculation — readers who visit more than one page per session — rather than clicks alone. As Streicher puts it, “Publications that are just focusing on clicks alone are not driving a loyal audience. And that means that you don’t have sustainability over time.” The platform also takes a more privacy-forward stance than Google Analytics, masking IP addresses by default and prohibiting the transmission of personally identifiable information.
Who each tool is built for
Parse.ly fits newsrooms with lower publishing volume where historical trend analysis matters more than real-time dashboards. Current, with its 43,000 weekly page views and handful of daily stories, is a good example. Newsrooms running WordPress gain an additional advantage through native integration. And teams without dedicated analytics staff will find Parse.ly accessible — Janssen is “the go-to tech guy on our staff, just because I’m the nerdiest about this kind of stuff,” but, “I’m not a coder.”
Chartbeat fits newsrooms that publish frequently enough to benefit from real-time optimization. The Salt Lake Tribune, with around 30 reporters and 100 total staff, uses real-time data to make immediate editorial adjustments — swapping homepage positions, refining headlines, doubling down on coverage areas showing strong engagement. Newsrooms that want A/B testing for headlines and images will find Chartbeat’s capabilities more developed than any competitor’s. Organizations with someone in an analytics-focused role will get the most from the real-time features.
Pricing and practical differences
The biggest practical difference is cost. Parse.ly’s entry-level plan starts at $2,000 per month for sites with up to 5 million monthly unique visitors, with conversion tracking at higher tiers. Chartbeat’s Essentials plan starts around $13,000 annually, and a lower-cost starter plan is in development. Both require contacting sales for custom quotes.
Their approaches to data differ at a fundamental level. Parse.ly makes historical data intuitive and accessible — daily, weekly and monthly views that reveal patterns over time. Chartbeat prioritizes real-time responsiveness — seeing what’s happening now and acting on it immediately. Both track engagement time, subscriber conversions and traffic sources, but the weight each gives to real-time versus historical analysis shapes the entire experience.
Frequently Asked Questions
Chartbeat excels at real-time analytics—showing what’s happening on your site right now—making it ideal for editors making immediate publishing decisions. Parse.ly is stronger for historical analysis and long-term content strategy, with robust reporting on how content performs over time and which topics drive subscription conversion.
Chartbeat is the stronger choice for breaking news. Its heads-up display is purpose-built for real-time monitoring, with live visitor counts, traffic source breakdowns, and trending content alerts designed for editorial teams that need to act on data in minutes—not hours.
Parse.ly offers significantly more powerful historical reporting and content strategy tools, including long-term traffic trends, author and section performance analytics, topic segmentation, and detailed conversion tracking. Chartbeat’s historical capabilities are improving but remain secondary to its real-time strength.
Both platforms go beyond pageviews to measure quality engagement. Chartbeat focuses on Engaged Time—seconds readers actively interact with content. Parse.ly tracks Time on Page alongside scroll depth and return visitor patterns. Both metrics help editors understand whether content is genuinely resonating versus generating accidental traffic.
Yes. Some larger newsrooms use both—Chartbeat for day-to-day editorial decisions and Parse.ly for strategic content planning and reporting. Most mid-sized newsrooms find one platform sufficient. The choice typically comes down to whether real-time decision-making or historical content strategy is the greater priority.
The post Chartbeat vs. Parse.ly: Two approaches to the same newsroom problem appeared first on The Media Copilot.
]]> The public broadcasting trade publication needed data that made sense for a small newsroom. They found it by focusing on what matters over weeks and months, not minutes.
The post Current turned analytics into editorial clarity with Parse.ly appeared first on The Media Copilot.
]]>Public broadcasters across the country have been slashing staff following Congress’s decision to defund them. When South Dakota Public Broadcasting announced it was laying off eight people, Mike Janssen faced a question that would have stumped him a year earlier: Is this a story worth covering? The station isn’t one of the nation’s largest networks, and bigger outlets have cut more people from a single program.
Key Takeaways
- Current uses Parse.ly to make editorial calls amid public-broadcasting cuts.
- Editor Mike Janssen relies on weeks-and-months data, not minute-by-minute swings.
- Small newsrooms can replace gut-feel decisions without an enterprise team.
But Janssen, digital editor at Current, didn’t have to guess. His analytics told him the answer was yes. Every layoff story gets traction with Current’s readers, no matter how small the station. “Without that information, I would have thought, ‘Oh well, we should only cover the layoffs at the biggest stations, or we should only cover layoffs if it’s a large number of people,'” he says. Instead, the data showed him where his readers’ attention actually goes.
Current is a trade publication covering U.S. public broadcasting, founded in 1980 by the National Association of Educational Broadcasters—the precursor to NPR and PBS. Housed at American University’s School of Communication since 2011, the outlet publishes daily online stories and a quarterly print edition, drawing around 43,000 page views per week. A mix of foundation support, advertising, donations and subscriptions keeps it running. Janssen oversees three full-time reporters, an intern and a handful of freelancers. He’s also, by default, the newsroom’s analytics point person.
For a small operation like Current, finding the right analytics tool meant finding one that didn’t require a data science background to use. Parse.ly, with its emphasis on historical trends over real-time dashboards, turned out to be exactly what they needed—a way to understand audience behavior on timescales that actually matter for a publication that posts a few stories per day, not hundreds.
Starting with the right questions
Before touching any dashboard, Janssen approached analytics with a specific frame: What decisions will this data actually inform? Too many newsrooms, he says, “just gather data for the sake of having the data.” That’s a waste of time and money. “If you understand what your goals are with it, then it helps you narrow what data is actually going to be useful to you.”
For Current, the primary goal was clear: grow subscription revenue. That meant understanding what resonates with repeat visitors—the readers most likely to convert into paying subscribers. Single-visit traffic matters less than building a loyal audience that returns week after week. With that goal defined, Janssen could focus on the metrics that actually connected to outcomes rather than drowning in vanity numbers.
This clarity also helped justify the investment. At $2,000 per month for sites with up to 5 million monthly unique visitors, Parse.ly isn’t free. But compared to flying blind—or wrestling with tools that require coding skills to extract basic insights—the cost made sense for a newsroom trying to make smarter decisions about limited resources.
Getting set up without a developer
Current runs on WordPress, and since WordPress owns Parse.ly, integration was straightforward. “If you can install a plugin and insert some information into boxes in your CMS, you’ll be fine,” Janssen says. No custom code, no developer hours, no multi-week implementation project.
The plugin handles the technical work: installing tracking, extracting metadata, connecting the dashboard to the site’s content. Parse.ly began collecting data immediately after activation. For newsrooms running other content management systems, the setup is only slightly more involved—adding a line of JavaScript and following formatting instructions that Parse.ly’s integration team provides.
The onboarding process also helped Current identify which metrics to prioritize from the start. Parse.ly’s team walked them through the dashboard options, helping translate editorial goals into specific data views. This handholding matters for small teams without dedicated analytics staff.
Focusing on historical data, not real-time noise
The main Parse.ly dashboard shows a graph of the day’s traffic overlaid on an average of previous comparable days—Monday versus previous Mondays, for example. It displays page views, unique visitors and engagement time at a glance. Below the graph, two columns show top stories over customizable time periods.
But what makes Parse.ly work for Current is its handling of historical data. A publication posting a few stories per day doesn’t need minute-by-minute traffic updates. That granularity is noise, not signal. Janssen needed to see patterns across days, weeks and months—time frames that reveal what content actually matters to his audience.
“Month to month, if you look at our top 10 stories in terms of page views or any metric, it’s largely layoffs,” he says. “It just confirms, yeah, this is where we need to be focusing our attention because this is what people want to be reading about.” That kind of insight only emerges from looking at data over meaningful periods, not watching numbers tick up in real time.
Tracking what loyal readers actually want
Subscriptions require loyalty. One-time visitors rarely convert. So Janssen configured Parse.ly to surface what returning readers engage with, filtering out the noise of drive-by traffic. “I don’t care so much where the one-time visitors are coming from, but we do want to know where the folks are who keep coming back,” he says.
Parse.ly’s engagement time metric proved especially valuable for longer feature pieces—the kind of journalism that takes significant investment but may not rack up huge page view numbers. If readers who do find those stories spend real time with them, the investment was worthwhile. “I want to know that someone is at least engaging with it significantly, even if it’s not our top story that month,” Janssen says.
The platform also tracks conversions—what content drives specific audience behaviors like subscribing to a newsletter or becoming a paying member. Newsrooms can define which actions to track, connecting content performance directly to business outcomes rather than treating all page views as equal.
Setting up alerts and automated reports
With a fully remote team communicating primarily through Slack, Current integrated Parse.ly’s alert system directly into their workflow. When a story gets significant traffic, the platform sends a notification to a Slack channel called “Wins.” The team sees momentum building without having to constantly check dashboards.
Automated reports handle the routine performance reviews. Current receives regular summaries—configurable for daily, weekly, monthly or quarterly delivery—covering site-wide metrics, section-specific performance and individual author impact. These reports arrive in inboxes without anyone having to run queries or export data.
The combination of push alerts for spikes and scheduled reports for trends means the analytics work happens in the background. Janssen doesn’t have to carve out time to investigate the data; the data comes to him in digestible form.
Discovering where the readers actually are
Referral data revealed surprises. Janssen knew Current’s newsletter drove traffic, but Parse.ly quantified just how important that channel was. More unexpectedly, the data showed LinkedIn was a significant source of readers—a platform he hadn’t prioritized for distribution.
“If you didn’t have some kind of window into how all that’s working for you, I don’t really know how you would even figure out what to care about,” he says. Without analytics, social media strategy becomes guesswork. With it, you can see where readers actually come from and focus energy on the platforms that matter.
This insight changed how Current thinks about distribution. Rather than spreading effort evenly across every social platform, they could concentrate on the channels where their audience actually discovers content.
What didn’t work—and how they adapted
Current previously used Chartbeat for content analytics, but Janssen found that its focus on real-time data didn’t suit a low-volume publication. The real-time focus was solving a problem Current didn’t have.
Google Analytics, meanwhile, remained an option—it’s free, after all. But Janssen found it “bewildering” and hard to navigate. “I don’t want to go through that trouble,” he says. Big media companies can afford professional data analysts to wrangle Google Analytics; small newsrooms need tools that work for journalists wearing multiple hats.
- Real-time overload: Chartbeat’s strength became a weakness for Current’s publishing pace. Switching to Parse.ly’s historical focus provided data at useful timescales.
- Complexity barriers: Google Analytics’ depth requires expertise Current didn’t have. Parse.ly’s simpler interface meant Janssen could get insights without coding knowledge.
The results
The shift to Parse.ly gave Current something it hadn’t had before: confidence in editorial decisions. Janssen no longer has to rely on instinct about what readers want. “I don’t know how I would judge what to focus on if I didn’t have Parse.ly showing me, ‘This is what the audience cares about,'” he says. “Otherwise, it’s just me with my gut saying, ‘Oh, I think that people care about this.'”
The data validated some assumptions—yes, readers care about layoffs—and challenged others, like the importance of LinkedIn for distribution. It connected content decisions to subscription goals, helping a small team focus limited resources on journalism that builds loyal audiences rather than chasing clicks.
What’s next for Current
With the analytics foundation in place, Current can continue refining its understanding of what drives subscriber behavior. The data infrastructure now exists to test hypotheses about content strategy, measure results and adjust—a cycle that compounds over time as the newsroom learns what works.
For publications with similar profiles—small teams, niche audiences, limited technical resources—the lesson is less about Parse.ly specifically than about matching analytics tools to actual editorial needs. Real-time dashboards solve real-time problems. Historical trend analysis solves the questions that matter for publications building audiences over months and years.
Newsrooms evaluating content analytics platforms can request a demo at parse.ly. Entry-level plans start at $2,000 per month for sites with up to 5 million monthly unique visitors, with conversion tracking and additional features available at higher tiers.
The post Current turned analytics into editorial clarity with Parse.ly appeared first on The Media Copilot.
]]> Only one-fifth of Copilot news responses link to Australian sources, raising alarm about AI-driven news deserts.
The post Microsoft Copilot sidelines Australian journalism in AI news summaries, study finds appeared first on The Media Copilot.
]]>Microsoft Copilot overwhelmingly favors American and European media when generating news summaries for Australian users, according to new research from the University of Sydney.
Key Takeaways
- Only 20% of Microsoft Copilot news answers for Australian users link to Australian sources.
- University of Sydney study: Copilot favors CNN, BBC, and ABC America over local outlets.
- Researcher warns of AI-driven news deserts as global outlets dominate national queries.
Only about 20 percent of Copilot’s news responses included links to Australian sources, researcher Dr. Timothy Koskie found. The rest pointed to CNN, BBC and ABC America — despite the user being located in Australia.
“The technology basically sidelined Australian news,” Koskie told The Guardian.
Koskie analyzed 434 AI-generated news summaries for his paper, “Invisible journalists and dominant algorithms,” published this week. In three of seven news prompt categories, no Australian sources appeared at all.
When Australian outlets did surface, they were major players like Nine and the ABC. Smaller, independent publishers were absent. Local journalists were never mentioned by name.
For newsrooms outside the U.S., the findings illustrate a looming problem. As users increasingly get news through AI summaries without clicking through to original sources, outlets lose both traffic and the visibility that builds audience relationships. This echoes concerns raised in the 2026 Reuters Institute predictions about AI intermediaries reshaping news distribution.
“The Australian media ecosystem is already struggling with concentrated ownership, declining independent outlets and news deserts in regional areas,” Koskie said. AI tools “risk compounding Australia’s existing media pluralism challenges rather than alleviating them.”
Koskie recommends extending Australia’s news media bargaining code to cover AI tools and pushing AI companies to embed geographic location more effectively in their systems.
The stakes extend beyond Australia. Any market where local journalism competes with global English-language outlets faces similar risks as AI-generated news summaries become routine. Publishers exploring AI licensing standards may find geographic attribution increasingly critical to their survival.
The post Microsoft Copilot sidelines Australian journalism in AI news summaries, study finds appeared first on The Media Copilot.
]]> A content analytics platform takes a privacy-forward approach compared to competitors, but newsrooms still need to understand what's collected and how it's protected.
The post Chartbeat offers privacy advantages over Google Analytics, but publishers still own compliance risk appeared first on The Media Copilot.
]]>For news organizations, analytics platforms occupy a sensitive position. They need access to reader behavior—what people click, how long they stay, where they came from—to provide the insights that inform editorial decisions. But that same data can raise privacy concerns, particularly as regulations like GDPR and CCPA impose stricter requirements on how publishers handle audience information.
Key Takeaways
- Chartbeat’s editorial focus and default IP masking offer a privacy edge over Google Analytics.
- Newsrooms still own GDPR and CCPA compliance regardless of platform defaults.
- Understand what Chartbeat collects and how it’s stored before deploying.
Chartbeat positions itself as a privacy-forward alternative to broader analytics platforms. Unlike Google, which has extensive data collection interests across its advertising ecosystem, Chartbeat focuses solely on content analytics for publishers. That narrower scope, combined with specific technical controls, may make it more suitable for news organizations concerned about reader privacy and regulatory compliance.
But how much protection does the platform actually provide, and what responsibilities remain with each publisher?
Risks identified in Chartbeat’s security posture
The primary risk with any analytics platform is the aggregation of behavioral data. Chartbeat collects information about which stories readers view, how long they spend on each page, where they came from, and whether they return. Over time, this creates detailed pictures of reader behavior that could be sensitive if mishandled.
Chartbeat’s terms of service explicitly prohibit sending personally identifiable information (PII) to the platform. This shifts responsibility to publishers: if a newsroom’s implementation inadvertently captures PII—through URL parameters, for example—that’s a violation of terms rather than a platform failure.
The platform also relies on JavaScript tracking code installed on publisher websites. Any analytics implementation introduces potential attack surface, and newsrooms should verify that the code is loaded over HTTPS and hasn’t been tampered with.
Finally, while Chartbeat’s business model is aligned with editorial rather than advertising interests, the company is still a third-party vendor. Publishers are trusting an outside organization with continuous access to reader behavior data. That trust relationship requires ongoing due diligence, not just initial evaluation.
Security controls Chartbeat has implemented
Chartbeat’s documentation and case study materials describe several specific controls that distinguish it from more broadly focused analytics platforms.
The platform masks IP addresses by default, removing a key piece of identifying information from the data it collects. It requires HTTPS encryption for all data transmission between publisher sites and Chartbeat servers. Access controls use role-based permissioning, limiting who within an organization can view different types of data.
Chartbeat maintains comprehensive logging of permissions changes (at least 90 days) and data requests (at least 30 days). All servers are hosted on Amazon Web Services with industry-standard physical protections.
Compared to major competitors, Chartbeat’s approach is more privacy-forward. Google Analytics and Adobe Analytics both adhere to GDPR and CCPA guidelines with controls for data anonymity, but Google’s broader data collection interests across its advertising ecosystem create potential conflicts of interest around data usage. Chartbeat’s sole focus on content analytics reduces that concern.
The case study notes that Chartbeat’s “business model is aligned with editorial rather than advertising interests.” This structural difference may matter for news organizations that view advertising-driven data practices as a reputational risk.
Security checklist for Chartbeat users
Before trusting Chartbeat with reader data, newsrooms should verify the following with internal stakeholders and the vendor:
- Has your legal team reviewed Chartbeat’s data collection practices and confirmed compliance with applicable privacy regulations (GDPR, CCPA, state laws)?
- Have you audited your implementation to ensure no personally identifiable information is being sent to Chartbeat through URL parameters or other channels?
- Do you have documented procedures for responding to reader requests for data deletion or access under applicable privacy laws?
- Have you configured role-based access controls to limit which staff members can view different types of analytics data?
- Have you reviewed Chartbeat’s data retention policies and confirmed they align with your organization’s requirements?
- Have you updated your public-facing privacy policy to disclose the use of Chartbeat and the types of data collected?
- Do you have a process for periodically reviewing your analytics implementation as privacy regulations evolve?
These questions frame the due diligence process; they do not replace consultation with legal counsel.
Next steps for evaluating trust
Chartbeat offers meaningful privacy advantages over broader analytics platforms, particularly for news organizations wary of advertising-driven data practices. Its focus on content analytics, default IP masking, and prohibition on PII collection create a more privacy-forward foundation than many alternatives.
But no third-party tool eliminates privacy responsibility. Publishers must still ensure their implementations don’t inadvertently capture identifying information, maintain compliance with applicable regulations, and be prepared to respond to reader inquiries about data practices.
Newsrooms evaluating Chartbeat should include legal counsel in the review process, particularly around GDPR and CCPA compliance. They should also verify that their content management system and other integrations don’t pass prohibited data to the platform.
For publishers seeking analytics that inform editorial decisions without the privacy baggage of advertising-optimized platforms, Chartbeat’s approach merits serious consideration—provided the organization is prepared to fulfill its share of the compliance burden.
Contact Chartbeat at [email protected] for detailed documentation on data handling practices and security controls.
The post Chartbeat offers privacy advantages over Google Analytics, but publishers still own compliance risk appeared first on The Media Copilot.
]]> An affordable content analytics platform helps regional newspapers understand their audiences, test headlines, and make data-driven decisions without enterprise-level budgets.
The post Why mid-sized newsrooms choose Chartbeat for real-time analytics appeared first on The Media Copilot.
]]>For newsrooms operating between the scrappy startup and the major metro, analytics presents a familiar dilemma. Enterprise platforms like Adobe Analytics or Parse.ly offer sophisticated capabilities but come with price tags to match. Free tools like Google Analytics provide basic tracking but lack the real-time responsiveness that editorial teams need to adjust coverage on the fly.
Key Takeaways
- Chartbeat helps mid-sized newsrooms understand audience behavior live.
- Regional newspapers use it to test headlines and improve placements.
- The platform offers enterprise-grade data without enterprise pricing.
Chartbeat occupies a middle ground: a content analytics platform built specifically for publishers, with real-time dashboards, headline testing, and engagement metrics designed for editorial decision-making rather than advertising optimization. At roughly $13,000 annually for its Essentials plan—with a lower-cost starter tier reportedly in development—it’s positioned for the mid-sized outlets that make up much of American journalism.
Case studies and implementation materials point to several consistent reasons regional newsrooms adopt Chartbeat over alternatives.
1. Real-time visibility into what readers are doing right now
Chartbeat’s core value proposition is immediacy. Its dashboard shows, minute by minute, who is on the site, what they’re reading, and where they came from. Staff can see traffic spikes as they happen, identify which stories are exceeding or underperforming expectations, and respond in real time.
For newsrooms accustomed to checking analytics the next morning—or the next week—this changes the feedback loop. When a story starts gaining traction unexpectedly, editors can add related links, push it on social media, or assign follow-up coverage. When a story underperforms, reporters can diagnose whether the headline missed, the timing was wrong, or the topic simply didn’t resonate.
“It’s a really good early indicator to go in and beef it up,” says Brad Streicher, a Chartbeat customer success manager. “Do things like add related links, include multimedia elements, push it out on social. Just do anything you can to drive more people to the article, or get people to stay on the article longer.”
2. Headline and image testing that runs automatically
Chartbeat’s headline testing feature allows newsrooms to provide multiple headline options—or generate them with AI—and let the platform identify which performs best. Once a winner is determined, Chartbeat applies it automatically without requiring changes in the content management system.
Ian Swenson, director of news and audience analytics at The Salt Lake Tribune, calls this Chartbeat’s “killer feature.” “None of the competitors do that nearly as well,” he says.
The testing isn’t limited to headlines. Higher-tier plans include image testing for homepages, allowing editors to experiment with visual presentation without manual A/B testing infrastructure.
Critically, the optimization focuses on engagement rather than raw clicks. Time spent on page and recirculation—whether readers move to another story on the site—matter more than traffic alone. “Publications that are just focusing on clicks alone are not driving a loyal audience,” Streicher notes. “And that means that you don’t have sustainability over time.”
3. Engagement metrics that go beyond pageviews
Chartbeat emphasizes metrics that correlate with reader loyalty rather than vanity numbers. The platform tracks time spent reading, scroll depth (how far readers get through an article), and recirculation rates. These indicators help newsrooms understand not just whether readers showed up, but whether they stayed and came back.
This orientation reflects a broader shift in how publishers think about audience development. A story that generates 100,000 pageviews from social media users who bounce after three seconds is less valuable than a story that generates 10,000 views from readers who finish the article and click through to another.
Higher-tier Chartbeat plans add subscriber conversion tracking, allowing newsrooms to see which stories lead to paid subscriptions or newsletter sign-ups. For outlets that depend on reader revenue, this connects editorial decisions directly to business sustainability.
4. A homepage “heads-up display” for editors
Chartbeat offers a dedicated view for monitoring homepage performance. The heads-up display compares each story’s traffic against historical averages for its position, showing which items are over- or under-performing relative to where they’re placed.
This allows editors to optimize story placement in real time. If a story in a prominent position is underperforming, it can be swapped out. If a story lower on the page is exceeding expectations, it can be promoted. The display also shows scroll depth indicators, revealing where readers tend to leave the homepage.
For newsrooms that still treat the homepage as a primary destination—rather than ceding discovery entirely to search and social—this visibility helps maximize the value of limited real estate.
5. Pricing accessible to regional outlets
Chartbeat’s cost structure is one of its clearest differentiators. The Essentials plan typically starts around $13,000 annually, with the company indicating a lower-cost starter tier is in development. By comparison, industry data suggests Parse.ly averages around $86,000 per year, and Marfeel’s enterprise pricing reflects its more comprehensive feature set.
Swenson is direct about why the Tribune chose Chartbeat: it “frankly, is the cheapest of the three” among the platforms he’s used. Competitors like Marfeel and Parse.ly “are more feature-rich,” he acknowledges. “Marfeel, for example, has AI up and down their product. It’ll give you what you should tweet out. It’ll do all those sorts of things if you want. But I find that that’s not what most journalists are looking for. They’re looking for how to better connect with your audiences.”
For mid-sized newsrooms that need real-time analytics and headline testing but don’t require enterprise-scale features, Chartbeat’s pricing makes sophisticated analytics accessible.
Who should consider Chartbeat
The platform fits best for newsrooms that want real-time editorial insights, have staff who will monitor and act on analytics, and need to track engagement metrics beyond basic pageviews. It’s particularly suited for outlets balancing editorial quality with financial sustainability—regional papers, nonprofit news organizations, and digital-native outlets in the mid-market tier.
Newsrooms with very small budgets may find even Chartbeat’s pricing challenging, though the upcoming starter plan may address this. Organizations that need extensive historical analysis, built-in content recommendation engines, or white-label solutions may find alternatives better suited to their needs.
For outlets seeking affordable, editorial-focused analytics that help reporters and editors understand their audiences in real time, Chartbeat offers a focused solution without enterprise-level complexity or cost.
Newsrooms interested in evaluating Chartbeat can contact the company at [email protected] for demos and pricing.
Frequently Asked Questions
Chartbeat is a real-time audience analytics platform built specifically for publishers. It shows editors exactly how readers engage with content right now—live visitor counts, scroll depth, traffic sources, and whether audiences are reading or scanning—designed for editorial decisions made in minutes, not days.
Chartbeat is purpose-built for editorial decision-making. Unlike Google Analytics, it emphasizes Engaged Time (how long readers actively interact with content) over raw pageviews, and its heads-up display is designed for editors who need to respond to traffic patterns in real time during a fast-moving news cycle.
Key features include a real-time dashboard with live article-level visitor counts, Engaged Time as a quality metric, headline A/B testing (Chartbeat Headlines), mobile and social traffic breakdowns, trending alerts, and historical benchmarking—all designed to help editors decide which stories to promote or update.
Yes. Chartbeat integrates with major CMS platforms including WordPress, Arc Publishing, Drupal, and others. It offers Slack integrations for real-time alerts and API access for custom implementations. Most mid-sized newsrooms can connect Chartbeat to their existing stack without significant engineering work.
Chartbeat pricing is negotiated based on monthly unique visitors and is not publicly listed. Mid-sized newsrooms typically pay several thousand dollars annually. Chartbeat offers demos and custom quotes—requesting a trial to evaluate it against your specific editorial workflows is the best first step.
The post Why mid-sized newsrooms choose Chartbeat for real-time analytics appeared first on The Media Copilot.
]]> A nonprofit newspaper relies on real-time analytics to allocate reporting resources, test headlines, and build a sustainable reader base.
The post How the Salt Lake Tribune uses Chartbeat to guide editorial decisions appeared first on The Media Copilot.
]]>When The Salt Lake Tribune needed to understand which coverage areas were worth expanding and which were better left to specialized competitors, the 150-year-old newspaper turned to Chartbeat, a real-time content analytics platform built for publishers.
Key Takeaways
- The Salt Lake Tribune uses Chartbeat to allocate reporting and test headlines.
- Data led to doubling religion reporting and scaling back outdoor coverage.
- For mid-sized nonprofits, real-time analytics replaces gut-feel planning.
The result: a data-informed approach to coverage that led the Tribune to double its religion reporting staff while scaling back expectations for outdoor content that wasn’t finding an audience. For a mid-sized nonprofit newsroom balancing editorial ambition with financial sustainability, the platform provided evidence where intuition alone had guided decisions.
Chartbeat’s Essentials plan typically costs around $13,000 annually, with a lower-cost starter tier reportedly in development. Implementation requires adding JavaScript tracking code to the site, with data appearing in dashboards within 10-15 minutes.
The gist
Chartbeat helped the Tribune turn reader behavior data into actionable editorial strategy.
- Real-time dashboards show who’s on the site, what they’re reading, and where they came from
- Headline testing identifies which options drive the most engagement, then applies winners automatically
- The Tribune expanded religion coverage from 1.5 to 3 full-time reporters based on audience data
How they use it
The Salt Lake Tribune integrates Chartbeat into daily editorial workflows across multiple touchpoints.
- Real-time monitoring: Staff track current traffic, top-performing stories, and traffic sources throughout the day, responding to spikes by adding related links or promoting stories on social media.
- Headline testing: Editors provide multiple headline options for key stories; Chartbeat identifies which performs best and applies it automatically without CMS changes.
- Coverage allocation: Analytics revealed that religion coverage consistently outperformed hiking content, informing the decision to expand the religion beat.
- Story framing: Data showed that restaurant reviews focused on diner experience outperformed chef profiles, leading reporters to restructure how they approach dining coverage.
- Engagement tracking: Beyond pageviews, staff monitor time spent on articles and recirculation rates to identify stories that build loyal audiences rather than drive one-time clicks.
Key metrics
The Tribune tracks several indicators tied to its strategic goals.
- Religion beat expansion: Grew from 1.5 reporters to 3 full-time religion reporters based on audience engagement data
- Engagement focus: Prioritizes time on page and recirculation over raw traffic numbers
- Subscriber tracking: Higher-tier Chartbeat features connect story performance to subscription conversions
What to watch for
Chartbeat requires clarity about goals and ongoing attention to deliver value.
- Strategic alignment: “Is it enough to just build readership? Or are you looking to grow newsletter subscriptions?” asks Ian Swenson, the Tribune‘s director of news and audience analytics. Define success metrics before diving into dashboards.
- Staff engagement: The platform works best when reporters and editors actively monitor and respond to data, not just analytics specialists.
- Plan limitations: Historical data retention varies by subscription tier; mobile app functionality is more limited than desktop.
- Cost considerations: At roughly $13,000 annually, Chartbeat is more affordable than Parse.ly or Marfeel but still represents a meaningful investment for smaller outlets.
- Privacy review: Chartbeat masks IP addresses by default and prohibits personally identifiable information, but newsrooms should review data practices with legal counsel.
Newsrooms considering Chartbeat can request demos and pricing at [email protected]. Initial demonstrations typically require 30-45 minutes.
Frequently Asked Questions
The Salt Lake Tribune uses Chartbeat’s real-time dashboard to inform editorial decisions about homepage story placement, social media timing, and staff resource allocation during breaking news. The data helps editors understand which stories are actively engaging readers and which need promotion—shifting homepage decisions from intuition to evidence.
Chartbeat data helps editors decide which stories to feature prominently on the homepage, when to push social media posts for maximum impact, how long a story should stay in a prominent position, whether a story needs a new headline to improve click-through, and where to direct reporters’ update efforts during a developing story.
This is an important editorial consideration. Analytics data should inform decisions without overriding journalistic judgment—viral doesn’t equal important. Newsrooms like the Salt Lake Tribune that use analytics effectively establish explicit policies about when and how data influences story placement, separating audience insight from audience pandering.
For nonprofit newsrooms focused on reader revenue rather than advertising, Chartbeat’s Engaged Time metric is particularly valuable—it correlates with subscription intent better than raw pageviews. Understanding what content drives deep engagement helps nonprofit newsrooms prioritize journalism that serves their mission and supports long-term sustainability.
Setup requires adding a JavaScript tracking snippet to your CMS, configuring site section and author tracking, and training editorial staff to interpret the dashboard. Chartbeat offers onboarding support and the dashboard is intuitive enough for non-technical journalists to use confidently after a brief orientation session.
The post How the Salt Lake Tribune uses Chartbeat to guide editorial decisions appeared first on The Media Copilot.
]]> A nonprofit newspaper used real-time analytics to double down on religion coverage, rethink restaurant reviews, and build a more sustainable reader base.
The post What the Salt Lake Tribune learned by putting Chartbeat at the center of its newsroom appeared first on The Media Copilot.
]]>From red desert rocks to green alpine meadows, Utah offers hikers an embarrassment of riches. For a regional newspaper like The Salt Lake Tribune, local hiking content should be a natural fit.
Key Takeaways
- Salt Lake Tribune put Chartbeat at the center of its editorial process.
- Real-time analytics changed how editors assigned stories and resources.
- Data-informed decisions improved both editorial coverage and engagement.
Not really, according to data from content analytics platform Chartbeat.
“We’ve written about these hikes,” says Ian Swenson, director of news and audience analytics at the Tribune. “We’re not getting (much) response there.” Readers looking for hiking content, it turned out, were visiting sites devoted to the subject rather than the local paper. “We know there’s a huge potential audience for it, but we’re not capturing that audience. So maybe we should spend our attention somewhere else.”
That kind of insight—concrete, sometimes counterintuitive, and immediately actionable—is what drew The Salt Lake Tribune to Chartbeat and kept them there. For a mid-sized nonprofit newsroom balancing editorial ambition with financial sustainability, real-time analytics offered a way to turn hunches into evidence and evidence into better journalism.
This is the story of how one newsroom learned to use data not as a replacement for editorial judgment, but as a sharpening tool for it.
A nonprofit newsroom looking for sustainable coverage
Founded in 1871 as The Tribune & Utah Mining Gazette, The Salt Lake Tribune converted to nonprofit status in 2019—the first legacy newspaper in the country to make that transformation. The move came after years of financial turmoil that had rocked the newspaper industry since the dawn of the internet.
Today, the Tribune operates with around 30 reporters and 100 total staff, supported by a mix of subscriptions, advertising, and philanthropic donations from foundations and individual supporters. It’s a “decently mid-size newsroom,” in Swenson’s words, one that has won Pulitzer Prizes but still faces the same resource constraints as regional outlets everywhere.
Swenson’s role straddles the editorial and business sides of the publication. He uses analytics to help reporters and editors shape coverage “so it reaches the audiences that they’re trying to reach,” while also monitoring what drives subscriptions and donations. The goal is not to chase clicks for their own sake, but to understand reader behavior well enough to make smarter decisions about where to invest limited reporting resources.
Rethinking what “resonates” actually means
Before Chartbeat, the Tribune—like most newsrooms—relied on a mix of intuition, experience, and delayed metrics to gauge whether stories were working. What happens to an article once you hit publish? Do readers find it? If they do, do they come back for more?
“That data is incredibly crucial,” says Brad Streicher, a customer success manager at Chartbeat. “Rather than just writing articles and then sending it out into the internet—it’s kind-of blind from there as far as what happens. Having data to make strategic decisions in your newsroom is something that Chartbeat solves.”
For the Tribune, that meant examining assumptions about what readers wanted. Take restaurant coverage: without analytics, dining reporters tended to focus on profiling the chef. “What we find when you look at the analytics is, those types of stories don’t get read very well,” Swenson says. Focusing the headline and lead paragraphs on what the diner will experience—the food, the atmosphere, the value—brought in more readers.
“I’ve definitely worked with several dining reporters over the years where that transition makes a big difference,” he says. That doesn’t mean ignoring the chef’s story. It just means drawing in the reader first. “While they’re in there, they can read this great profile about the chef.”
Doubling down on religion coverage
The hiking versus religion contrast became a touchstone for how the Tribune approached coverage decisions. In Mormon-dominated Salt Lake City, religion coverage performed consistently well according to Chartbeat data. Hiking content did not.
The newsroom responded by expanding its religion beat. “We’ve doubled down on our religion coverage over the years,” Swenson says. The Tribune went from one-and-a-half reporters on the beat to three full-time religion reporters. “And that has led to an increase in the number of religion stories as well as an overall increase in how well they’re reaching audiences.”
This is the kind of decision that analytics can inform but not dictate. The Tribune didn’t abandon hiking coverage entirely; it simply allocated resources based on evidence about where the paper could build a loyal audience rather than compete against specialized outdoor sites.
Living inside the real-time dashboard
Chartbeat’s real-time dashboard became the Tribune‘s “bread and butter,” as Streicher puts it. The interface is organized around three questions: who is on the site, what they’re reading, and where they came from.
The “who” section shows total viewers minute by minute, time spent on articles, and recirculation—the percentage of readers who move from one story to another. It breaks down subscribers versus guests, new versus returning visitors, devices, and locations.
The “what” section ranks articles by current traffic and displays a graph of traffic over time. Spike alerts notify staff when a story gets significantly more attention than expected—a signal to “go in and beef it up,” Streicher says. “Do things like add related links, include multimedia elements, push it out on social. Just do anything you can to drive more people to the article, or get people to stay on the article longer or dive deeper into your website.”
The “where” section tallies referrals from search engines, social platforms, email, and direct visits. Staff can filter by any dimension to understand, for example, which stories loyal subscribers are reading versus casual visitors.
‘I’m a strong believer philosophically that reporters being aware of how their stories are doing is to everybody’s good, especially the readers’ good.’
Ian Swenson, director of news and audience analytics at the Tribune
Headline testing as a “killer feature”
Swenson calls Chartbeat’s headline testing its “killer feature.” Provide a few options—or let AI generate them—and the platform identifies which headline receives the most engagement. “None of the competitors do that nearly as well,” he says.
Once a winner is identified, Chartbeat applies it automatically. “You don’t need to change it in your CMS,” Streicher explains. “You don’t need to alter it anywhere. You just literally click start, and we do all the work for you.”
Critically, the optimization doesn’t chase clicks for their own sake. Time spent on a page matters more than raw traffic. Readers who visit more than one page are more likely to return. “Publications that are just focusing on clicks alone are not driving a loyal audience,” Streicher says. “And that means that you don’t have sustainability over time.”
Making reporters better at their jobs
The Tribune started using Chartbeat before Swenson arrived, so he says he can’t put hard numbers on the impact. But he’s emphatic about what the tool enables.
Chartbeat allows newsrooms to track which stories lead to paid subscriptions, newsletter sign-ups, or any other metric a newsroom deems essential. It can help maximize advertising revenue by optimizing headlines and other SEO factors. But beyond the financials, Swenson argues, it makes reporters better at their jobs.
“I’m a strong believer philosophically that reporters being aware of how their stories are doing is to everybody’s good, especially the readers’ good,” he says. Reporters can see in real time what’s working. And when a story doesn’t reach the expected audience, “it drives the sort of thinking about, ‘How … do I avoid that from happening next time?’ So, that awareness and usage of tools like Chartbeat just leads to better journalism.”
What the tool doesn’t do
Chartbeat doesn’t make editorial decisions. It doesn’t tell reporters which stories to pursue or which angles to take. It provides data; humans decide what to do with it.
The Tribune’s experience also underscores the importance of knowing what you’re trying to achieve before diving into analytics. “Is it enough to just build readership? Or are you looking to grow newsletter subscriptions? Are you trying to increase clickthroughs from your newsletter to the website?” Swenson asks. “Focus on metrics that align with your goals—don’t let the tool dictate your strategy.”
The platform also has limits. Historical data retention varies by plan. The mobile app is less capable than the desktop version. Some integrations require developer resources. And while Chartbeat is more affordable than competitors like Parse.ly or Marfeel, the Essentials plan still runs around $13,000 annually—a meaningful investment for smaller outlets.
A framework for sustainable journalism
For The Salt Lake Tribune, Chartbeat became more than a dashboard. It became a framework for thinking about coverage, audience, and sustainability in an era when all three are under pressure.
The insight that religion coverage outperforms hiking content didn’t just change a story or two. It informed a strategic decision to expand the religion beat from 1.5 reporters to three. That decision, in turn, produced more journalism that reached more readers who were more likely to subscribe and support the paper’s nonprofit mission.
“It actually affects the journalism, affects the questions you’re asking, what kinds of calls you’re making,” Swenson says. “You figure out who your audiences are and what your approach to the story is going to be at the very outset.”
Newsrooms considering Chartbeat can contact the company at [email protected] for pricing and demos. The platform typically requires 30 to 45 minutes for an initial demonstration.
The post What the Salt Lake Tribune learned by putting Chartbeat at the center of its newsroom appeared first on The Media Copilot.
]]>